How to Create a Status Dashboard with InfluxDB, Grafana, and Telegraf on ExyData

Introduction
A few days ago we released our status page on ExyData. We want to create that glass panel that shows you our the infrastructure that we use to provide services is doing. In this tutorial, we will show you how to create a status dashboard with InfluxDB, Grafana, and Telegraf on ExyData.
Prerequisites
Before you start, you need to have the following prerequisites:
- An ExyData account, you can create one for free here.
- An InfluxDB instance, you can follow instructions on how to create one in our docs here.
- A Grafana instance, you can follow instructions on how to create one in our docs here.
- A Telegraf that you can run in your local or other server. The cool part about Telegraf is super small and easy to install. You can follow instructions on how to install it in InfluxData Docs here.
The Architecture
The architecture of the status dashboard is simple. We will use Telegraf to collect data from our infrastructure and send it to InfluxDB. Then, we will use Grafana to visualize the data in real-time.
Here is a diagram of the architecture:
Step 1: Install Telegraf
The first step is to install Telegraf on your local or other server. You can follow the instructions on how to install Telegraf in the InfluxData Docs here.
Step 1a: Configure Telegraf
This is the configuration that we are using for Telegraf and it is working well for us. You can copy and paste it into your telegraf.conf file.
You need to replace the placeholders $INFLUXDB_URL, $INFLUXDB_DATABASE, $INFLUXDB_USERNAME, and $INFLUXDB_PASSWORD with your InfluxDB URL, database, username, and password. Also make sure to replace the URLs in the [[inputs.http_response]] section with the URLs you want to monitor.
# Telegraf Configuration

# Global Agent Configuration
[agent]
  interval = "1m" # How often to gather metrics
  round_interval = true
  metric_batch_size = 1000
  metric_buffer_limit = 10000
  collection_jitter = "0s"
  flush_interval = "1m"
  flush_jitter = "0s"
  precision = ""
  debug = false
  quiet = false
  logfile = ""  # Use "" to write to stderr

# Output Plugins Configuration
[[outputs.influxdb]]
  urls = ["$INFLUXDB_URL"]
  database = "$INFLUXDB_DATABASE"
  username = "$INFLUXDB_USERNAME"
  password = "$INFLUXDB_PASSWORD"

# Input Plugins Configuration

# HTTP Input Plugin to monitor HTTP response
[[inputs.http_response]]
  urls = ["https://exydata.com", "https://api.exydata.com/docs", "https://cloud.exydata.com"]
  method = "GET"
  follow_redirects = true
Step 1b: Start Telegraf
After you have configured Telegraf, you can start it by running the following command:
sudo systemctl start telegraf
Step 2: Deploy InfluxDB
The next step is to deploy InfluxDB. You can follow the instructions on how to deploy InfluxDB in our docs here.
Using the CLI, you can create a database and a user with the following commands:
exy deploy \
    --database influxdbv1 \
    --cloud aws \
    --region us-east-1 \
    --plan hobbyst \
    --org_id <your-org-id> \
    --token <your-access-token>
Once is deployed and your changed your password, how to do it here you are ready to replace the placeholders in the Telegraf configuration file with your InfluxDB URL, database, username, and password.
Step 3: Deploy Grafana
The final step is to deploy Grafana. You can follow the instructions on how to deploy Grafana in our docs here.
exy deploy \
    --database grafana \
    --cloud aws \
    --region us-east-1 \
    --plan hobbyst \
    --org_id <your-org-id> \
    --token <your-access-token>
After you have deployed Grafana, you can access it by going to the URL provided by ExyData and logging in with the credentials that we sent you to your email.
Step 3a: Configure InfluxDB Data Source
The first thing you need to do is to configure the InfluxDB data source in Grafana. You can follow the instructions on how to configure the InfluxDB data source in our docs here.
Step 4: Create a Status Dashboard
Now that you have Telegraf collecting data from your infrastructure and sending it to InfluxDB, and you have Grafana configured to visualize the data, you can create a status dashboard. Our dashboard looks like this and you can access it here.
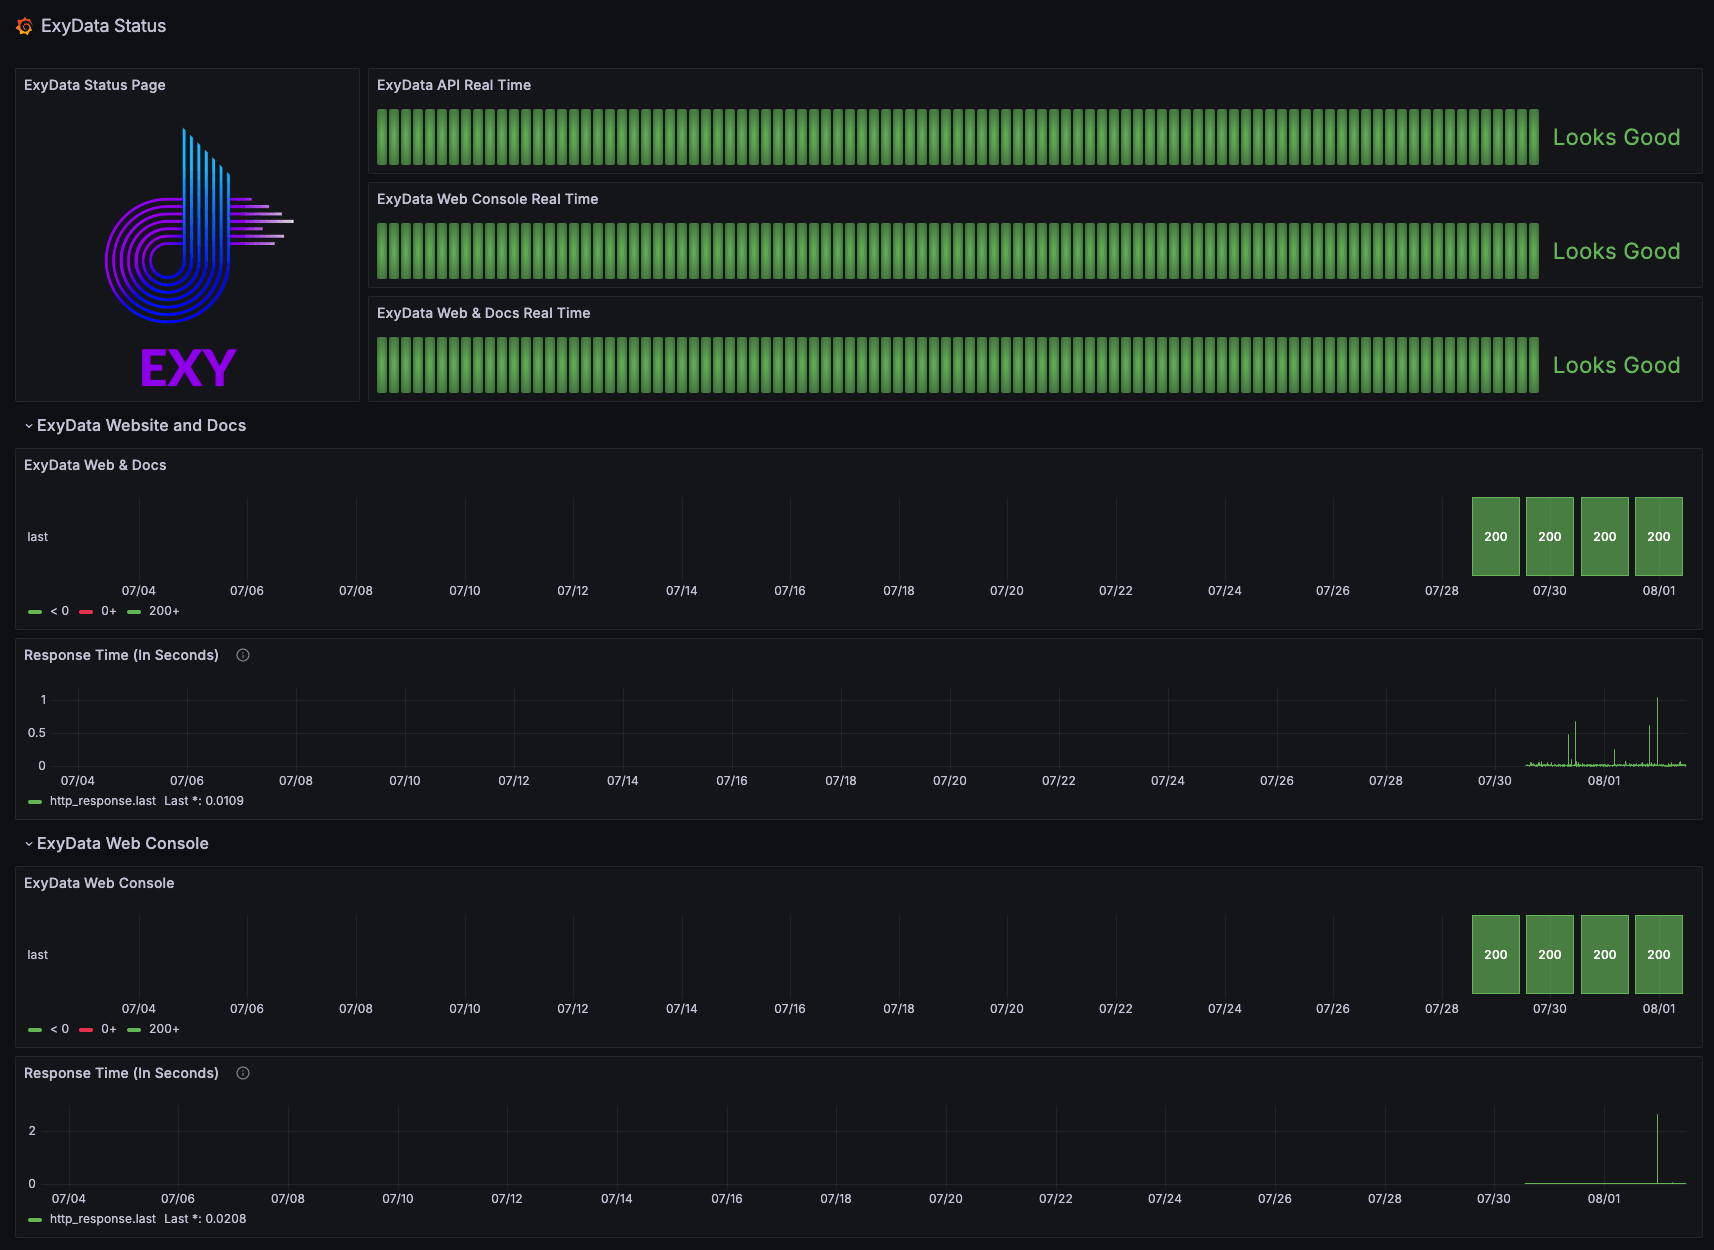
This dashboard can be a starting point for you to create your own status dashboard. You can customize it by adding more panels, changing the colors, and adding alerts if you want.
You can download the JSON file of our dashboard here and import it into your Grafana instance to get started.
Conclusion
In this tutorial, we showed you how to create a status dashboard with InfluxDB, Grafana, and Telegraf on ExyData. You learned how to collect data from your infrastructure using Telegraf, store it in InfluxDB, and visualize it in Grafana. You can use this dashboard to monitor your data infrastructure in real-time and make informed decisions.
If you have any questions or feedback, feel free to reach out to us on through our contact form. We would love to hear from you!