Deploy Grafana
Grafana is an open-source analytics and monitoring solution. It allows you to query, visualize, alert on, and explore your metrics no matter where they are stored. In plain English, it provides you with tools to turn your time-series database (TSDB) data into beautiful graphs and visualizations.
You can use Grafana in the ExyData Platform to visualize your data from InfluxDB v1.8, InfluxDB v2.7, TimescaleDB, and QuestDB that also are offered as a managed service in the ExyData Platform.
Deploy Grafana
Considerations
To deploy a new Grafana service, you need to run the following command, but before of that, you need to consider the following:
-
Size: The size of the instance that you want to deploy. You can see the available sizes here. Its important to size your instance according to your needs. You need to have in mid number of data sources, dashboards, concurrent users, data that you going to pull from the data sources, etc. If you need help with this, please contact us at [email protected].
-
Region: The region where you want to deploy your instance. You can see the available regions here. This is important because the region will affect the latency of your queries. You will want to deploy your instance in the region that is closer to your users.
Deploy Grafana
Deploying a new Grafana service is very easy. You just need to run the following command:
exy deploy \
--cloud aws \
--database grafana \
--org_id your-org_id \
--token your-awesome-token \
--plan professional \
--region us-east-1
The response will be a JSON object with the following properties:
{
  "cloud": "aws",
  "resource_id": "5c9f5b5c",
  "database": "grafana",
  "org_id": "your-org_id",
  "plan": "professional",
  "region": "us-east-1",
  "created_at": "2019-03-27T12:34:56.789Z",
  "port": "port",
  "url": "https://5c9f5b5c.customers.exy.io:3000",
  "username": "admin",
  "password": "admin"
}
You can use the url, username, and password to access your Grafana instance.
Change the password
Is highly recommended to change the password of your Grafana instance. You can do that in the first login or in the profile section.
When you login for the first time, you will be asked to change the password. The screen will look like this:
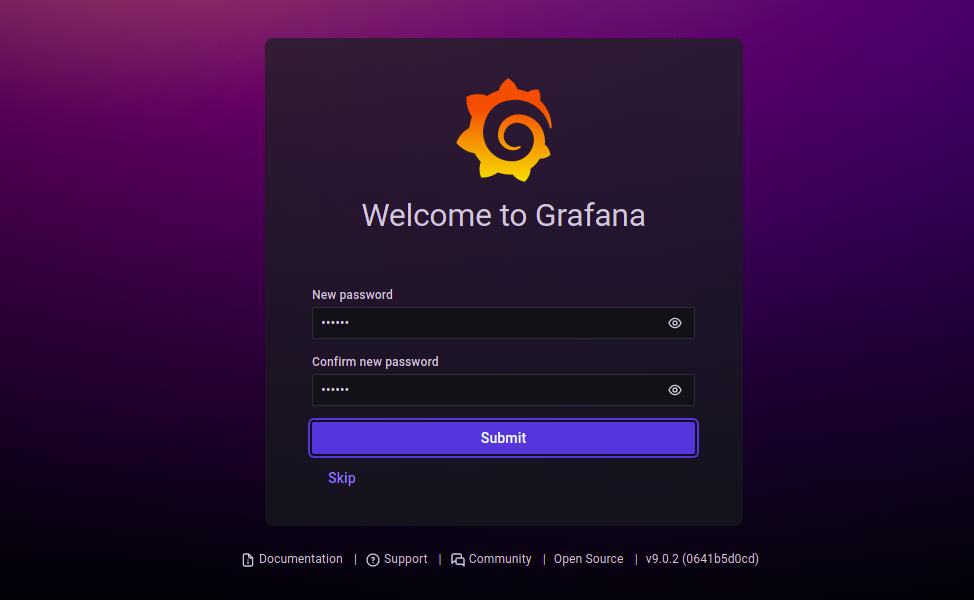
If you want to change the password later, you can do that in the profile section. Follow the steps in the Grafana documentation here.
Ready to roll?
Now that you have your Grafana instance up and running, you can start to add data sources and create dashboards. You can find more information about Grafana in the official documentation here.
If you have any questions, please contact us at [email protected].